Northern Algo
Market Visualization & Decision Support for Small-Cap Traders
2
Live · Early Access
1
In Development
The Northern Algo Approach
Markets are constantly communicating information through price, volume, participation, and momentum. The challenge for most traders isn't access to information; it's knowing what matters and how to interpret it.
Northern Algo programs are built around market visualization and decision support. Rather than relying on isolated signals or overwhelming traders with unnecessary complexity, our tools are designed to organize market information into a structured framework that helps traders better understand context, identify meaningful opportunities, and make more confident trading decisions.
Every Northern Algo program is developed using real market data and extensive testing across changing market conditions. Our focus is simple: build practical tools that help traders see the market more clearly and support a disciplined, process-driven approach to trading.
Choose Your PRO Tools
See exactly what each tool unlocks. Free scripts live on the Free Scripts page.
Key Levels PRO
Structural confluence heatmap for small-cap and mid-cap stocks with large relative daily volume changes
PRO Unlocks
- Confluence scoring and heatmap colours
- HVDL stacking and merged zones
- Weighted psychological level hierarchy
- Premarket and After-Hours HOD levels
- Major Confluence labels and enhanced tooltips
- Confluence-only filtering
- Advanced display and scoring controls
- Lifetime updates
Divergence PRO
Multi-timeframe divergence and momentum visualization — usable across all markets on time frames up to 1h
PRO Unlocks
- MACD, RSI, SMI and Volume divergences
- Bearish divergence on new highs and retests
- Developing pre-signals before confirmation
- Severity-based signal colours
- Advanced anchors, gates, and recovery logic
- Enhanced tooltips and diagnostics
- Lifetime updates
Northern Algo - Ticker DNA
A historical behavior table for any ticker — how it has closed after big gaps, how often it revisited each EMA target, and how large its runs have been on its highest dollar-volume days
Inside The Table
- Gap closing colors — red, green and flat after large opening gaps
- PM and RTH EMA target hit rates across five intraday EMAs
- Average run on its ten highest dollar-volume days
- Top-three historical runs with a caution tier
- Recent-five-run weighted average for the latest setups
What It Helps You Judge
- Fraction plus percentage on every row (8/10 | 80.0%)
- Coverage symbols so known lower bounds stay clearly marked
- Hover evidence: source dates, prices and dollar-volume estimates
- Five-year lookback ranked by dollar volume, not recency
- Context for gap fades, target revisits and extension risk
- Lifetime updates
Northern Algo PRO Suite
Structural levels. Momentum evidence. Ticker history. One complete view.
What's Included
- Key Levels PRO — structural levels and zones
- Divergence PRO — momentum and participation evidence
- Ticker DNA — historical ticker statistics
Suite Benefits
- Structural levels and divergence in one workflow
- Momentum and participation evidence near key areas
- Historical ticker behavior for added context
- One subscription covering all three indicators
- Lifetime updates during Early Access
Free TradingView Scripts
Open-source Pine Script tools from Northern Traders — free for everyone to use.
Visual Gallery
See It In Action
Chart screenshots and video walkthroughs of each tool.
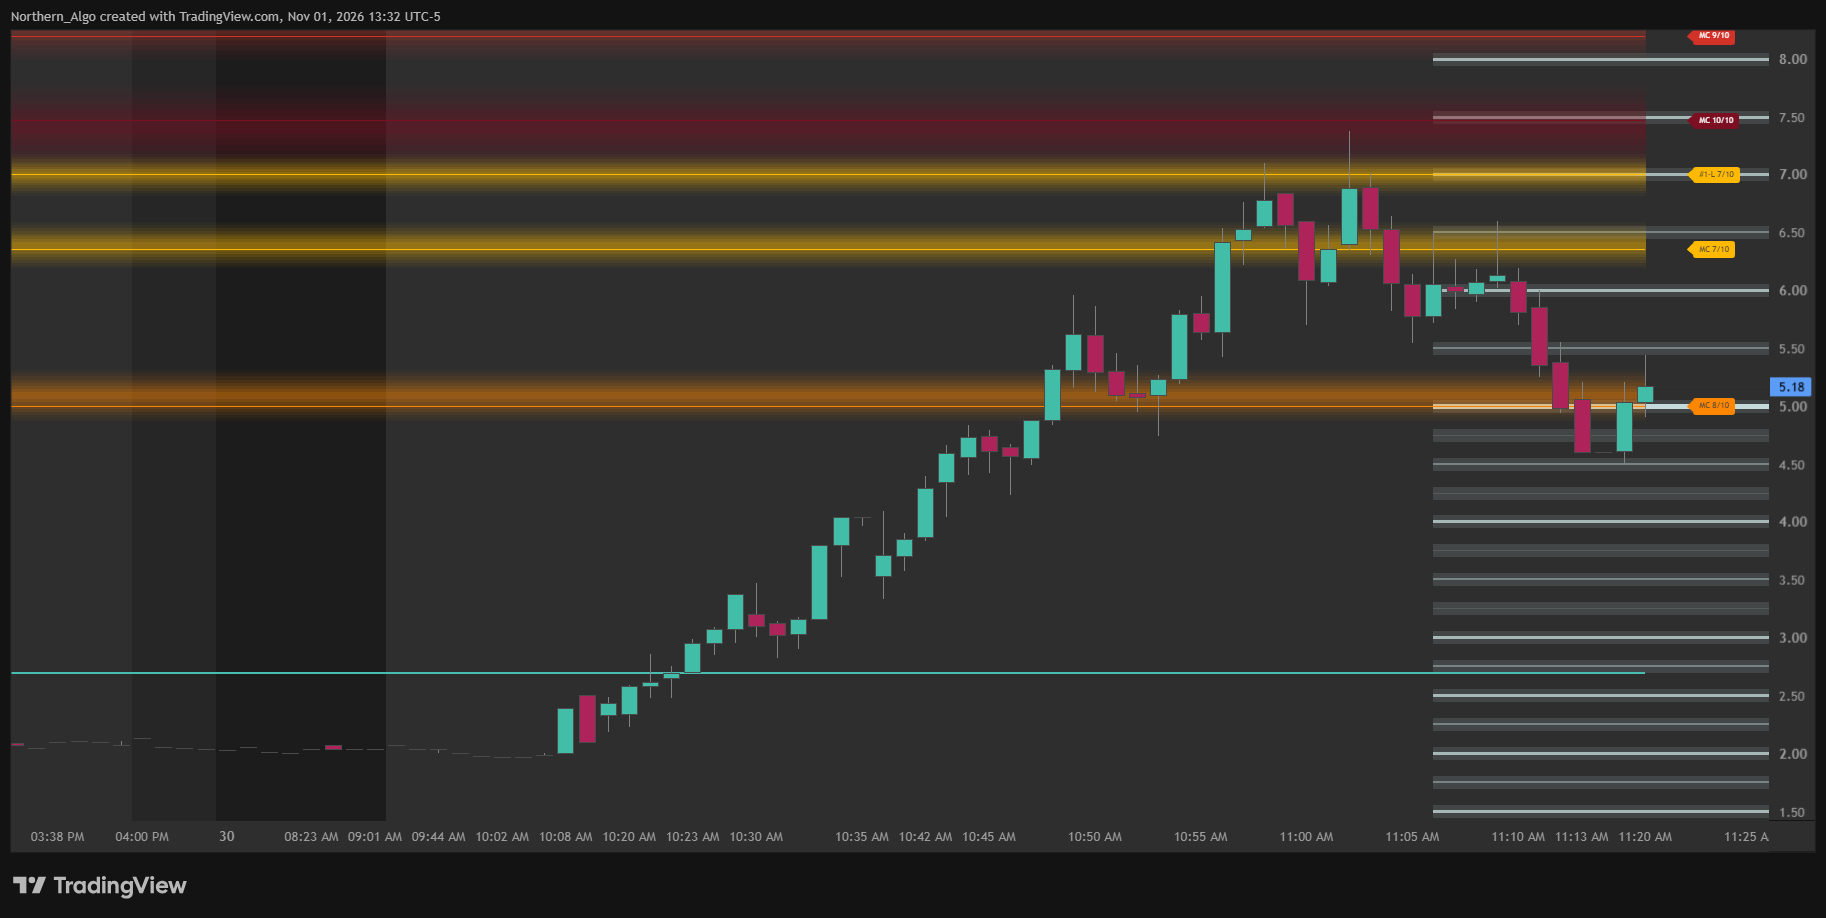
Ranked high-volume support & resistance zones with strength-rated capsule tags
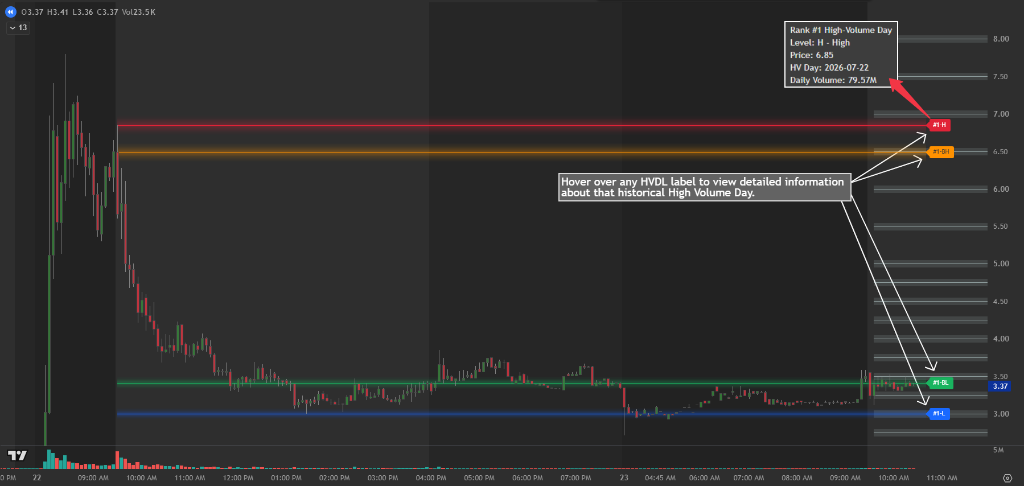
Hover any HVDL label for rank, price, date, and daily volume
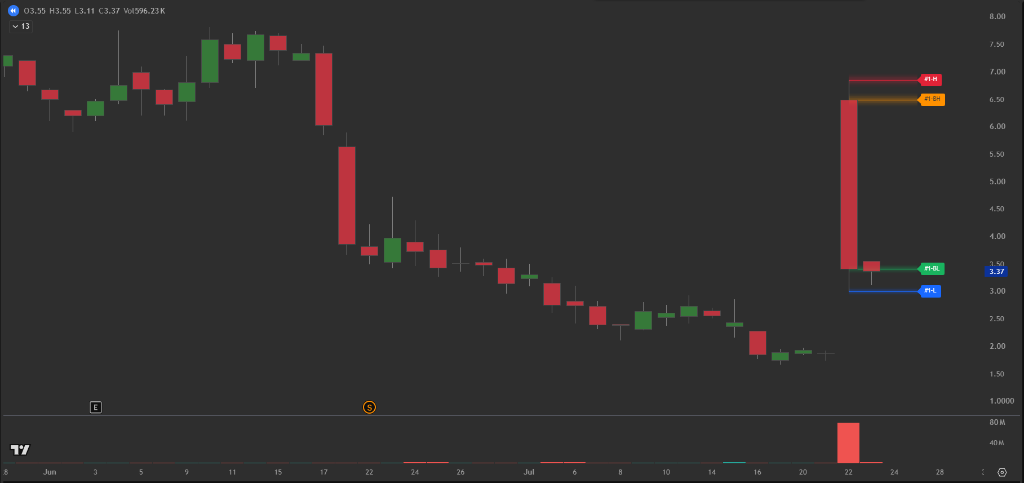
Ranked support & resistance levels with color-coded capsule tags
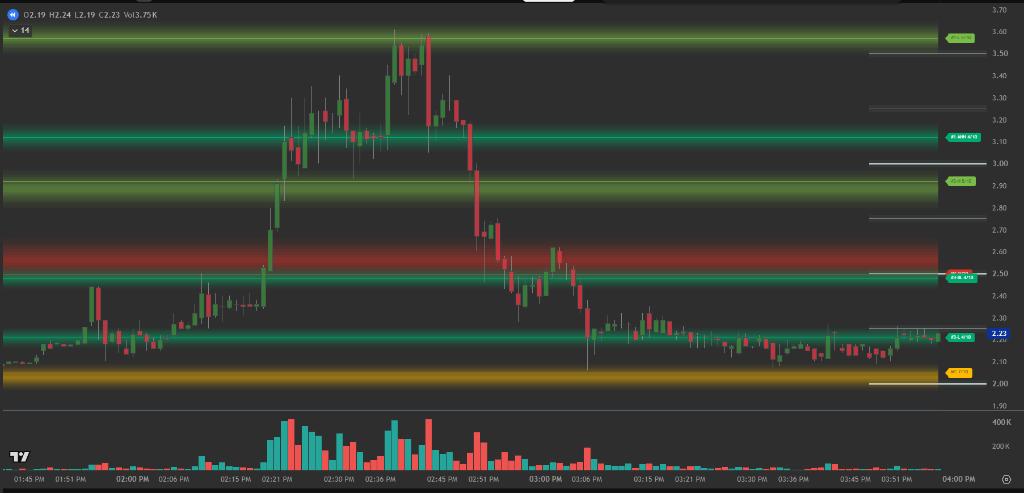
Structural heatmap zones with strength-ranked level tags
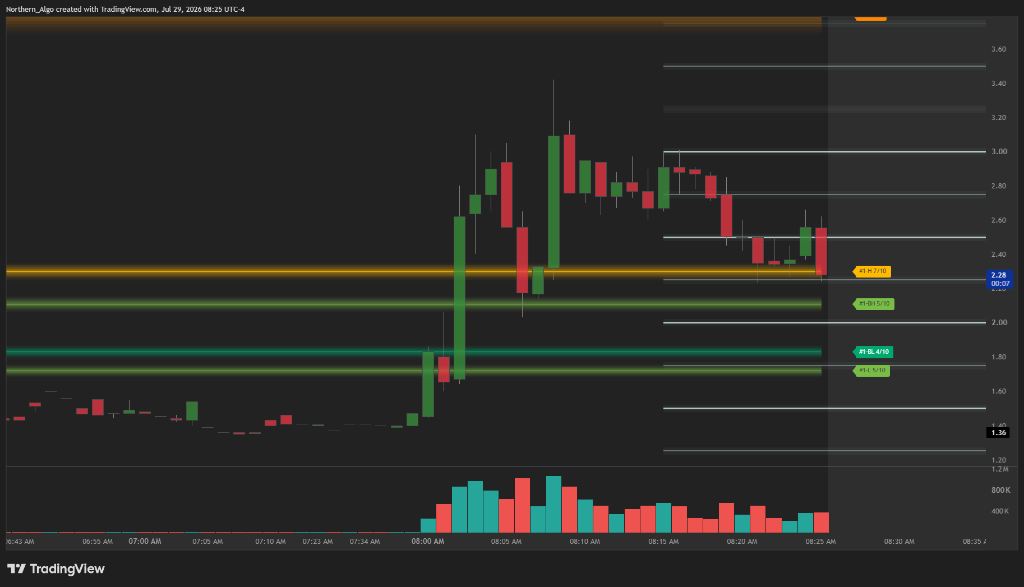
Live chart overlay — levels update in real time
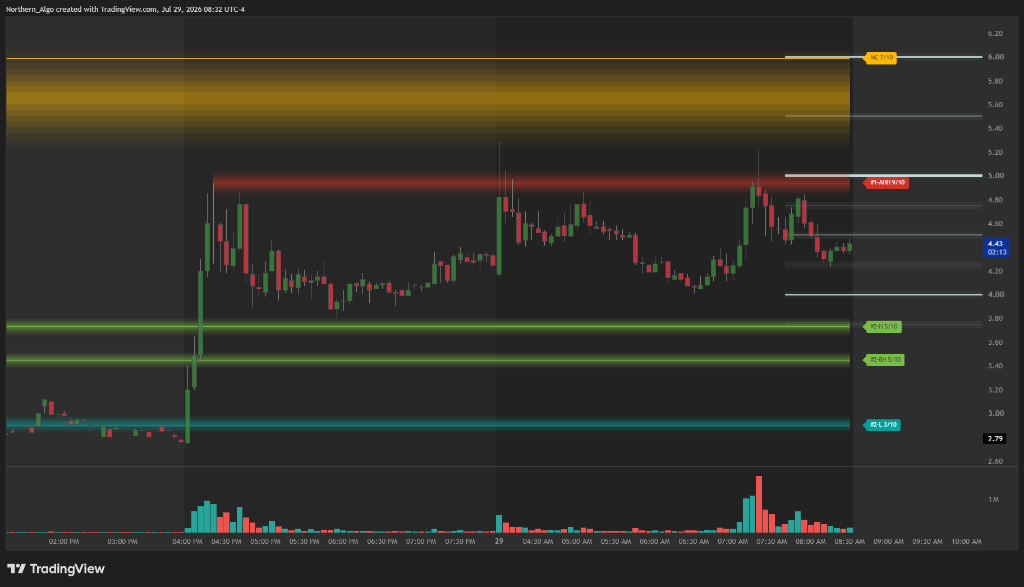
High-volume historical zones highlighted across the chart
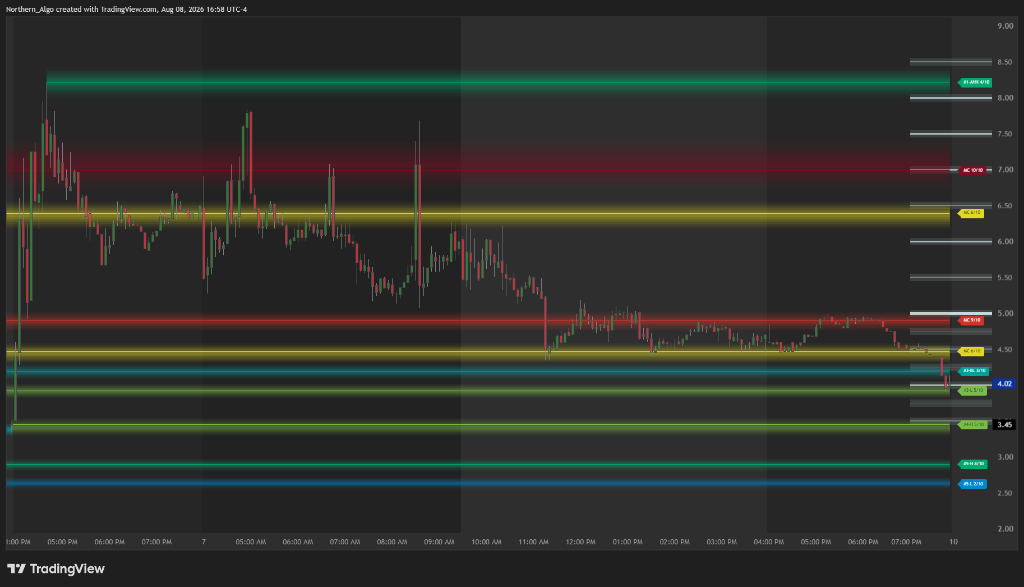
Ranked key levels with NC/HC strength tags across a bearish trend
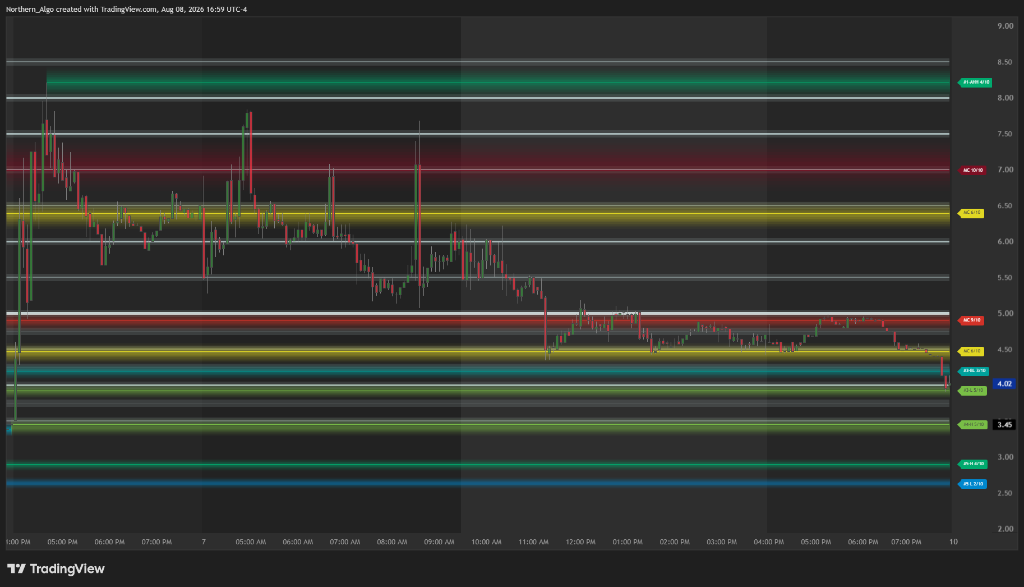
Multi-tier support & resistance bands with high/low capsule labels
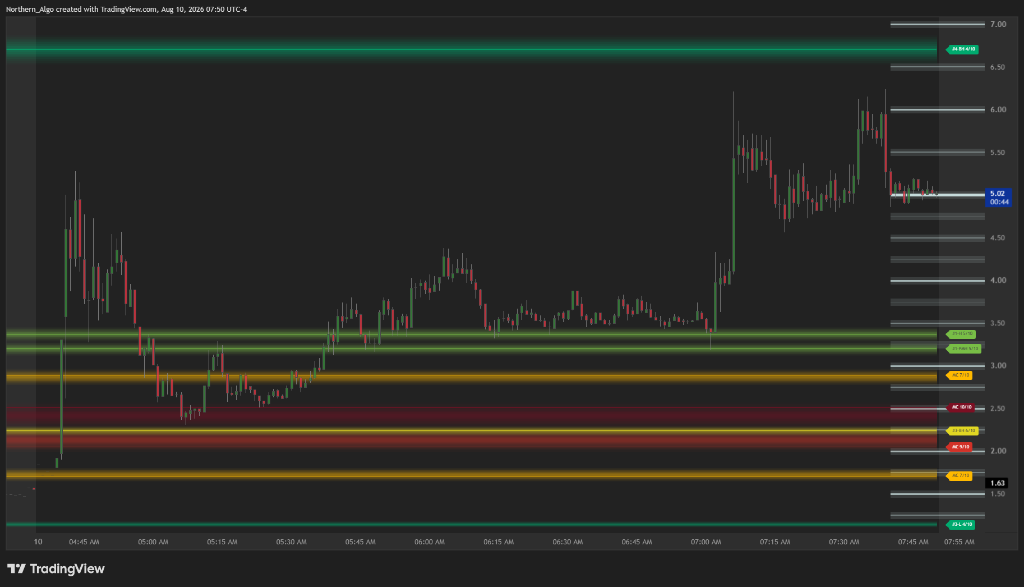
Breakout through stacked high-volume key levels with color-coded capsule tags